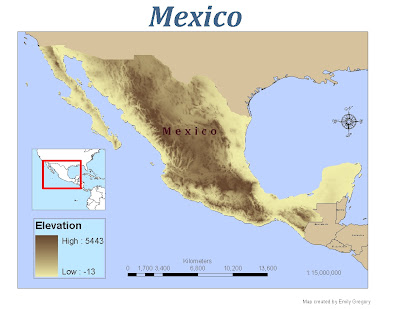
Map 3: This map was fairly easy to accomplish. I tried to figure out, to no avail, what units were being used for the elevation. I suppose I could have used another reference map but I really wanted to find out with the program. Is it feet or meters? I looked everywhere, except the right place... obviously.
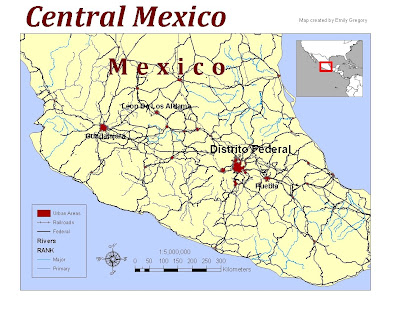
Map 2: Choosing the colors on this map drove me crazy. I suppose the conglomerate of information added to my frustration. It was difficult to make this map pleasing to the eye. I also had some trouble with the scale bar. I wanted to display 50 -100 then a progression by 100, no such luck.
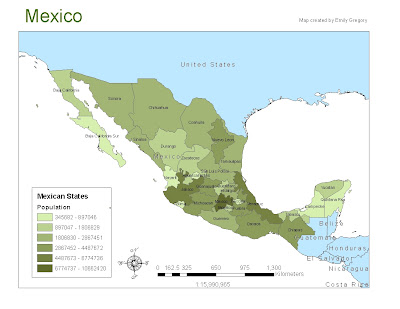
Map 1: I had to go back to the previous lesson in order to get the Population Data. I wasn't sure if it was the same due to the different labels.
 Map 3: This map was fairly easy to accomplish. I tried to figure out, to no avail, what units were being used for the elevation. I suppose I could have used another reference map but I really wanted to find out with the program. Is it feet or meters? I looked everywhere, except the right place... obviously.
  Map 2: Choosing the colors on this map drove me crazy. I suppose the conglomerate of information added to my frustration. It was difficult to make this map pleasing to the eye. I also had some trouble with the scale bar. I wanted to display 50 -100 then a progression by 100, no such luck.
 Map 1: I had to go back to the previous lesson in order to get the Population Data. I wasn't sure if it was the same due to the different labels.
No comments:
Post a Comment